
This Mid-Cap Just Moved Into a ₹4,000 Cr Opportunity
What Happens When a Component Supplier Moves Up the Value Chain

Welcome to Inside Small Caps — where we study SME, small and mid-cap businesses through concalls, annual reports and on-ground operating shifts.
In today’s edition, we revisit SJS Enterprises.
SJS was never an unknown name. It has long been a familiar supplier in India’s automotive ecosystem — especially in decorative aesthetics. For years, it built its reputation on precision printing, decals, dials, chrome logos — the visible elements that shape brand identity on vehicles and appliances.
What makes Q3FY26 important is not discovery.
It is a transition.
Because what was once largely a decorative aesthetics company is now positioning itself as a multi-technology interior and display solutions platform — and the numbers this quarter reflect that shift.
Q3FY26 — A Quarter That Signals Operating Leverage
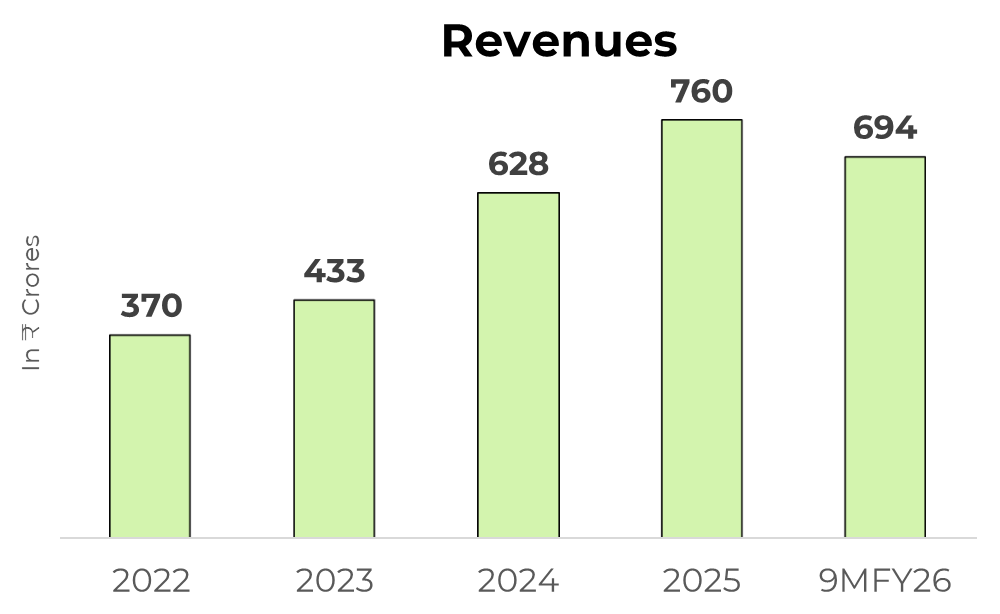
Revenue came in at ₹423.53 crore, the highest in the company’s history.
Growth was approximately three times the underlying automotive industry, driven by strength in both passenger vehicles and two-wheelers.
Margins expanded to:
30.5% EBITDA
18.5% PAT
Nine-month FY26 PAT has already surpassed full FY25 PAT. That is not a cyclical spike; it reflects operating leverage, improved mix, and higher contribution from new-generation products, which now form 23% of consolidated revenue.
Management has guided that sustainable EBITDA should normalize in the 28–29% band, implying that current performance is not viewed as a one-off aberration.
More importantly, growth guidance was revised upward — targeting 2.5x industry growth for FY26, compared to 2x earlier.
The quarter does not stand alone. It builds on a multi-year repositioning.
Growth is visible. Margins are expanding. But valuation ultimately decides returns. If you want to understand how to think about P/E properly — trailing vs forward — read The P/E Ratio Decoded. https://valueeducator.com/fundamental-analysis-basics/pe-ratio-trailing-vs-forward-explained
The Evolution : From Decorative Specialist to Platform Player
SJS began as a niche decorative player, specializing in precision overlays and aesthetic components.
At one stage, roughly 70% of revenue was linked to two-wheelers.
That concentration has steadily reduced through a combination of organic capability expansion and acquisitions.
Today’s revenue mix in Q3FY26 stands at:
Two-wheelers: 38.8%
Passenger vehicles: 42.3%
Consumer durables: 19%
Passenger vehicles now contribute more than two-wheelers — a structural shift compared to the pre-IPO phase.
This evolution unfolded in layers:
First, through the acquisition of Exotech (now SJS Decoplast), which brought chrome plating and painted premium components — increasing SUV and passenger vehicle exposure.
Then through Walter Pack India, adding IMF, IMD and IME technologies — enabling participation in premium interior aesthetic parts.
Each step expanded kit value per vehicle.
Q3FY26 adds another layer.
Financials
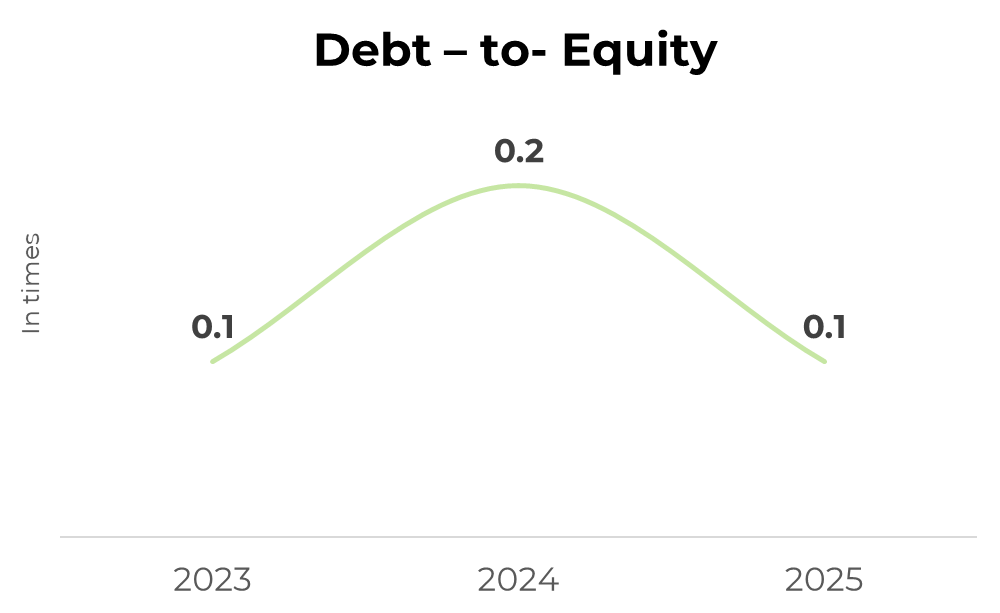
SJS’s balance sheet tells an equally important story — the company operates with a consistently low debt-to-equity ratio, giving it flexibility to expand without balance sheet stress.
If you want to understand why this ratio matters so much in small caps, check my detailed article on: What is Debt to Equity Ratio? Why it Matters for Small Cap Investing click on the link here: https://valueeducator.com/fundamental-analysis-basics/debt-to-equity-small-cap-investing
Exports — Moving from Opportunity to Execution
Exports touched ₹28.31 crore in Q3FY26.
146% YoY growth
22.1% QoQ growth
11.6% of revenue
Nine-month exports have already exceeded full FY25 exports.
The primary driver is the Stellantis global badging program, with supplies across North America, Latin America and Europe as plants ramp up.
A sales representative has been appointed in Germany to deepen European presence, aligning with the stated target of 14–15% export contribution by FY28.
Exports have historically carried superior realizations — a point consistently articulated in earlier disclosures — and are now beginning to contribute meaningfully to margin expansion.
The Structural Inflection — Entry into Automotive Display Systems
The most significant development this quarter is the formalization of a technology license and supply agreement with BOE Varitronix, a global automotive display player.
Until now, SJS’s positioning was largely within decorative and premium aesthetic parts.
With this agreement, the scope expands to:
Optical bonding
Assembly of automotive display systems
A complete display system integrates:
Cover glass
TFT screen
Backlight unit
Optical bonding
BOE will supply critical components while enabling localization.
This marks a transition from being a supplier of visible trims to participating in the digital cockpit architecture itself.
If you want to systematically evaluate companies undergoing this kind of transition, I’ve explained the framework in How to Analyze a Mid-Cap Company. https://valueeducator.com/mid-cap-stocks/mid-cap-company-analysis-framework
Why Display Changes the Equation
Management has consistently focused on increasing per-vehicle content.
Historically:
Legacy kit uplift ranged between 4–6x.
Current passenger vehicle kit uplift potential stands at 5–8x.
Display integration meaningfully expands that ceiling.
Industry context discussed in the concall indicates:
Roughly 30% of passenger vehicles currently use display systems.
Penetration is expected to approach 100% adoption by FY30.
Indian display market estimated at ₹3,000–4,000 crore by FY30.
Shift toward 10–12 inch integrated digital clusters.
Commercial revenues from this vertical are expected to scale from FY28 following plant readiness and validation cycles.
It is not near-term revenue. It is medium-term TAM expansion.
Capacity & Execution — Capital Being Deployed
Expansion across facilities suggests demand visibility.
SJS Decoplast (Pune)
A ₹100 crore plan, with ₹65–70 crore already incurred. Utilization currently around 95%, with completion expected in Q4.
SJS Bangalore
₹45 crore expansion underway. Utilization around 75%, with completion expected in Q4.
Cover Glass & Display (Hosur)
₹40 crore allocated across FY26 and FY27, with additional ₹20–25 crore under discussion. Commercialization expected from FY28.
Walter Pack operates at approximately 75% utilization.
The business is now in an execution-intensive phase rather than a planning phase.
What Q3FY26 Establishes
SJS has long been a recognized name in decorative aesthetics.
What Q3FY26 establishes is that the company is operating at:
A structurally higher revenue band
A structurally improved margin profile
A structurally expanded addressable market
Passenger vehicle exposure has overtaken two-wheelers. Export execution is visible. Display integration opens a new vertical.
The next few quarters will determine:
Margin stability within the 28–29% band
Export progression toward 14–15%
Display program confirmation and commercialization timelines
Commissioning of ongoing capex
If you an investor who keeps looking for such analysis on small & mid cap stocks, you can join our Emerging Titans model portfolio where we share detailed reports on such ideas. We are SEBI registered Research Analyst (with Registration No. INH000019789
Disclosure
This article is for educational purposes only and does not constitute investment advice. Readers should consult a SEBI-registered advisor before making investment decisions.
Standard warning
“Investment in securities market are subject to market risks. Read all the related documents carefully before investing.“
Disclaimers
“Registration granted by SEBI, enlistment with RAASB and certification from NISM in no way guarantee performance of the Research Analyst or provide any assurance of returns to investors.”